The statewide Public Employees Retirement System has caused a stir in Oregon’s public education system this winter, after underperforming investments in side accounts have forced school districts to reckon with how to pay off escalations in pension rates.
PERS, always a hot-button topic, also makes a convenient scapegoat in discussions on why Oregon’s spending on schools hasn’t result in improved student achievement. Maybe, goes the thinking, those dollars aren’t reaching the classroom?
Such speculation was revived two weeks ago, when WW published spending charts from the Edunomics Lab at Georgetown University, which show Oregon’s dramatic increases in education spending per pupil (up about 80% from 2013) have not translated to better outcomes for students. Since then, several parents responded to our story asking whether, without adjustments to account for expenses like PERS pensions, the numbers paint an incomplete picture.
These are valid questions. As the Oregon Capital Chronicle reported in November, Gov. Tina Kotek’s proposed $515 million boost to school funding would be more than wiped out by the projected $670 million that school districts will be expected to pay into PERS over the next two years.
But John Tapogna, a senior policy adviser with ECOnorthwest who specializes in education economics, says PERS didn’t stop money from reaching schools over the past decade, and doesn’t do much to explain declining student outcomes.
“PERS hasn’t gotten a whole lot worse in the last five to seven years,” he says, “so it doesn’t explain why the test scores did.”
The state’s pension system has been controversial for decades. Lawmakers in the 1980s and ’90s issued overly generous benefits for public employees, which means public employers now have to contribute larger portions of their operating budgets toward retirement costs. In order to help alleviate unfunded liabilities, many school districts invested in side accounts, or pension obligation bonds.
Now, as The Oregonian recently reported, those side accounts are suffering, which is why PERS has reemerged as a hot topic in the education sphere.
But because pension obligation bonds have largely paid off until recently, school districts have not seen large swings in their PERS rates in the past decade. In 2013, according to actuarial valuation reports by the business management consulting firm Milliman, school districts in Oregon were contributing about 13.2% of their operating budgets to PERS (after adjusting for side account contributions, among other factors). While the percentage has ebbed and flowed, it hasn’t moved significantly: In 2023, the rate was 15.41%.
Tapogna acknowledges that PERS rates in Oregon are above the normal range that would be ideal. (In a normal system, he says it would be optimal to have rates hover around 10% to 12%.) But that’s a predicament other states with once-generous pensions face now, too.
Tapogna concludes that PERS has been “pretty static.” “It certainly doesn’t help you explain the most recent declines in [student] performance,” he notes.
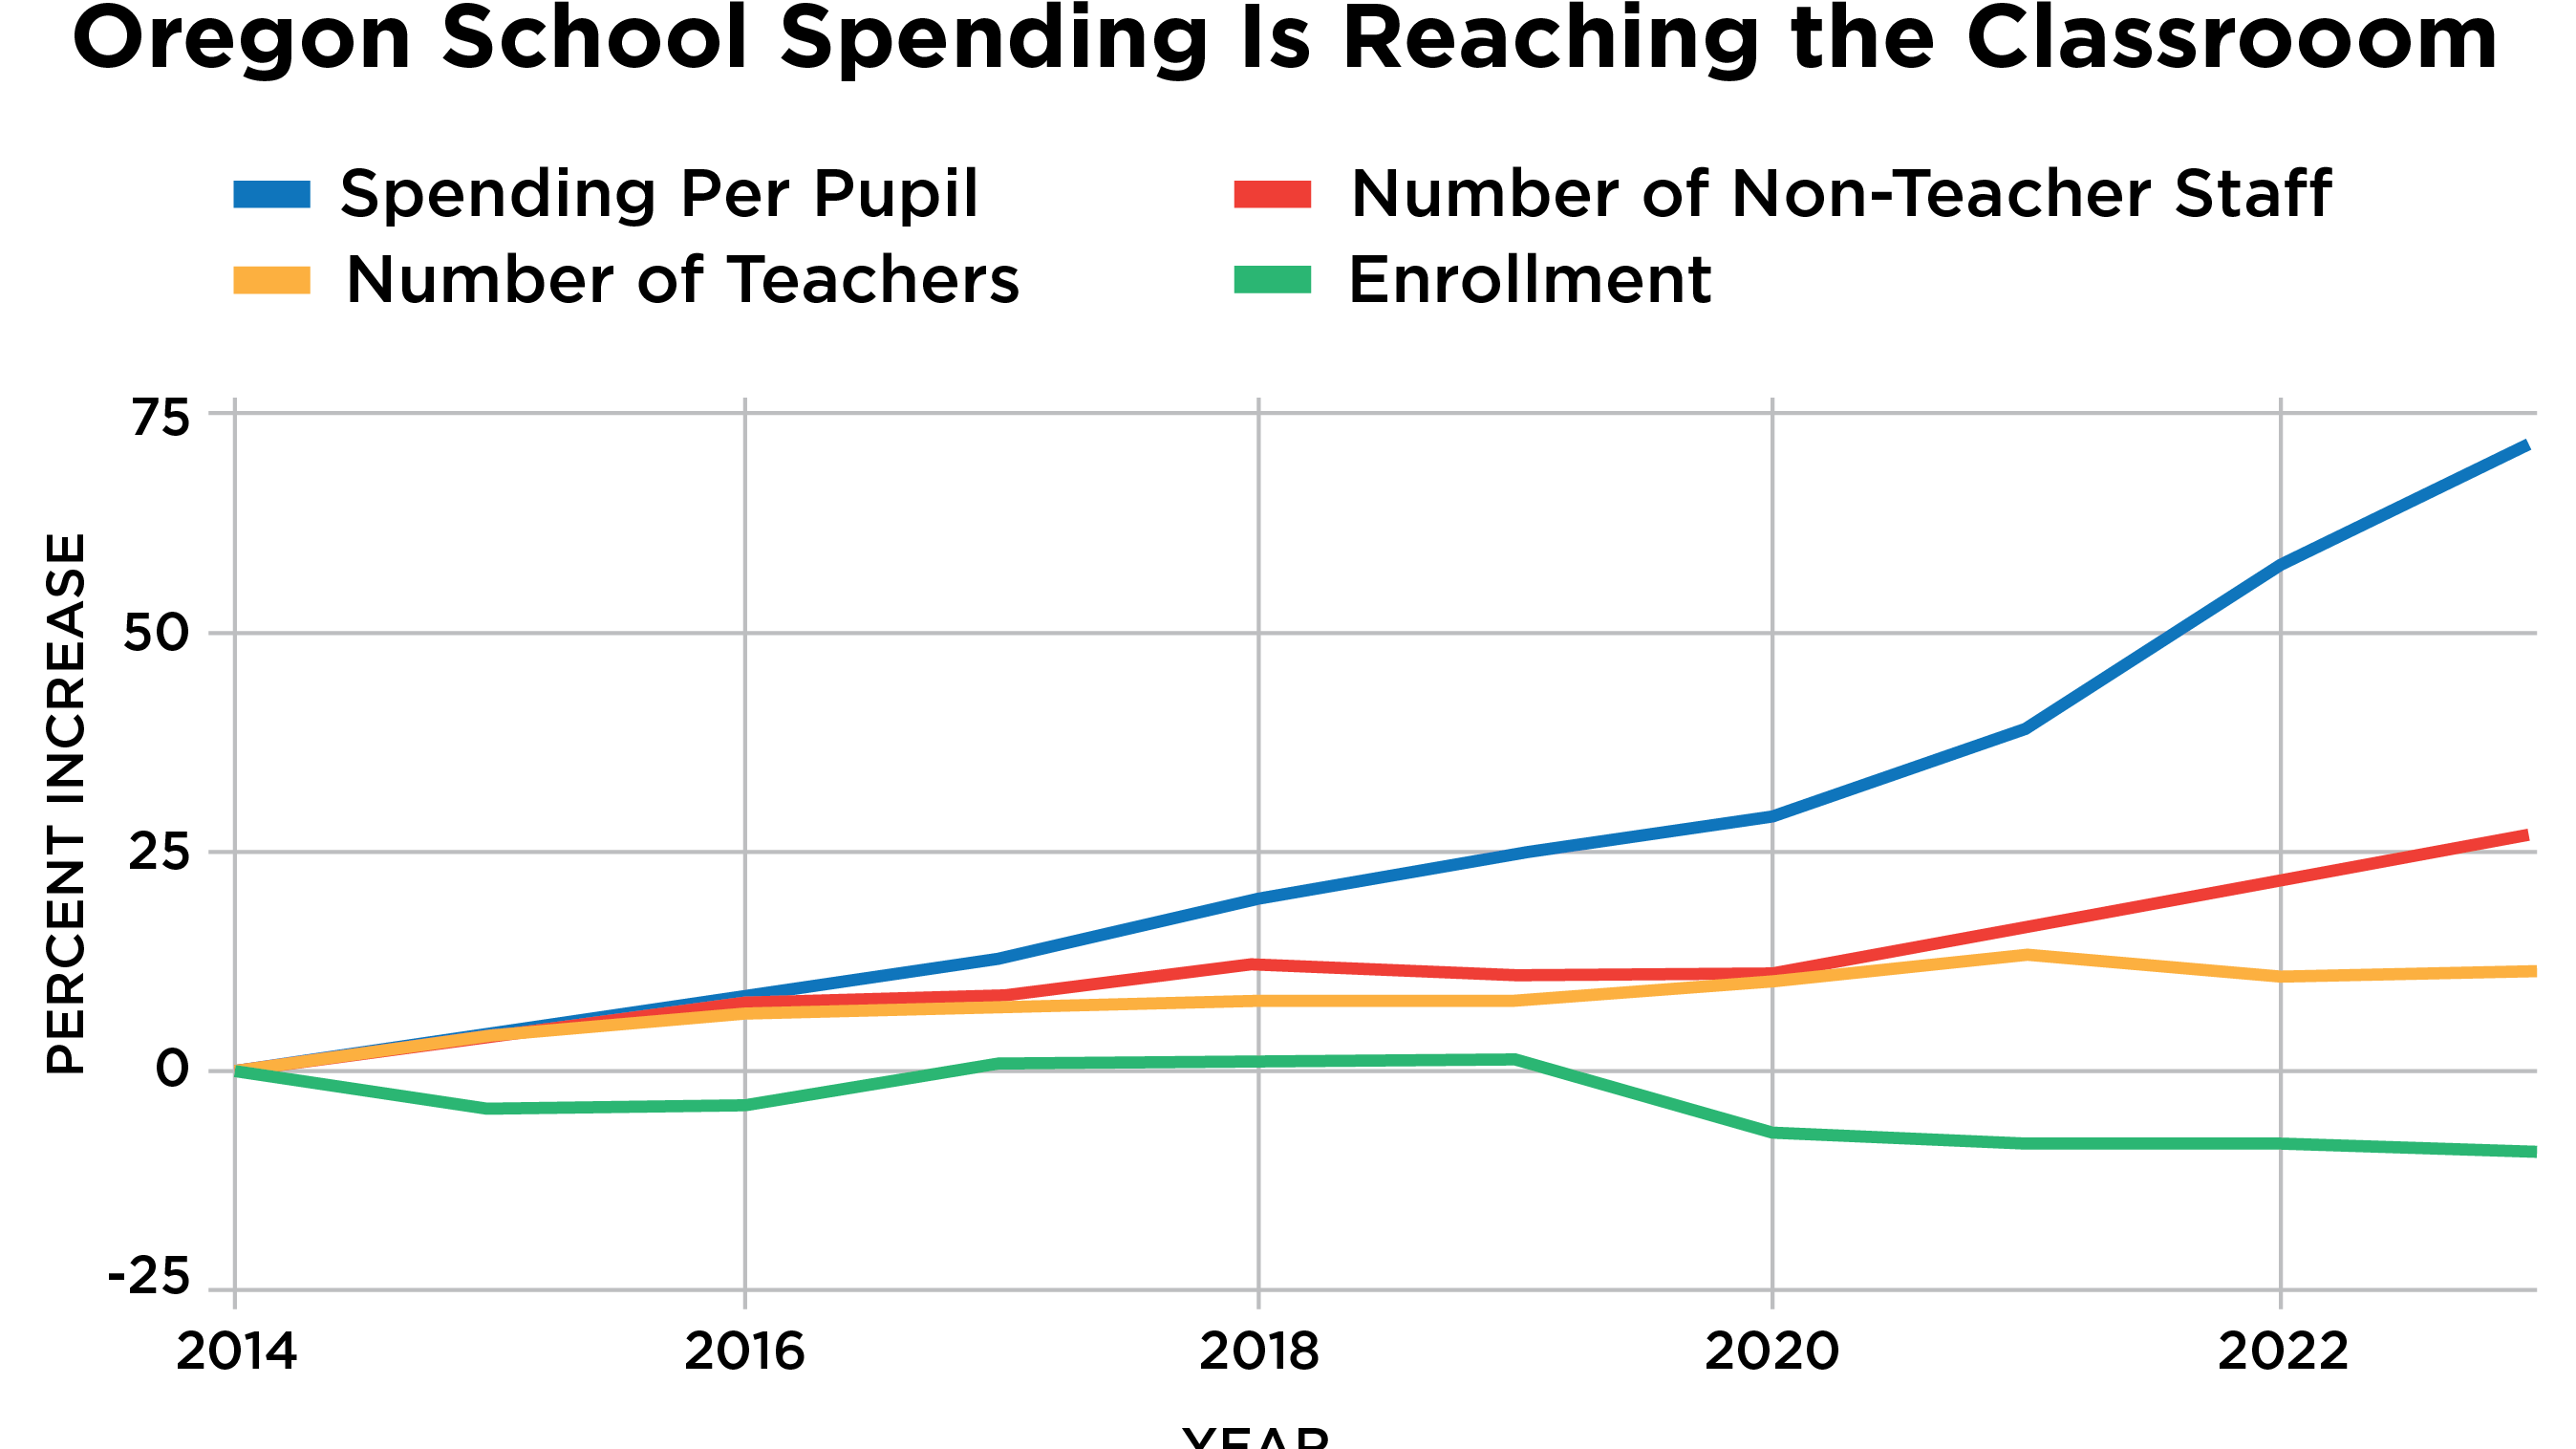
Staffing trends also suggest PERS hasn’t significantly siphoned money from classrooms. School staffing numbers have been on the rise, even as student proficiency has dropped by 11.6 percentage points in reading and 9.8 percentage points in math on state standardized testing since 2014.
Between 2014 and 2023, the National Center for Education Statistics reports, non-teacher, full-time equivalent staff in Oregon has increased by 27.5%. Teachers also increased by 11.6% during that period (see graph, upper right).
Meanwhile, student enrollment in Oregon in that same year range decreased by about 9%, from 601,318 to 547,424.
Tapogna says such an increase in staffing, even over a period with declining enrollment, shows money found its way to classrooms—or at least to school buildings.
“Despite the elevated PERS rates, they were able to hire more staff,” he says. “We do have more adults in the building now than we did before, and we have fewer kids, and we have worse performance.”
Oregon has done a “pretty remarkable job,” Tapogna adds, of increasing spending per student over the past decade, thanks in part to general fund allocations and the Student Success Act (a 2019 law that increased education funding by creating the corporate activities tax).
“We went from a bottom quartile state on spending per student to very close to the U.S. average over the course of a decade, which is a big lift,” Tapogna says. “That also happened to be a decade when performance falls off track. A bigger question than how much more should we be spending is, what on earth are we doing with the money we already have?”